Transforma tus datos en decisiones efectivas.

Soluciones avanzadas de Business Intelligence para optimizar tu crecimiento y competitividad.

Calificación: 5 estrellas

★★★★★

Transformamos datos en decisiones efectivas

En Luum, ayudamos a las organizaciones a optimizar procesos y maximizar el valor de la información mediante soluciones avanzadas de business intelligence y análisis estratégico.

red and white heart illustration

150+

15

Clientes satisfechos

Resultados comprobados

Servicios de Business Intelligence

Transformamos datos en decisiones informadas para impulsar el crecimiento de tu negocio en el mercado.

Automatización de tareas

Optimiza tus procesos mediante la automatización de tareas y mejora la eficiencia de tu organización.

An iPad displaying data visualization content next to a book titled 'Data Science for Business.' The iPad is showing notes and a diagram about dashboard design, accompanied by a stylus placed between the iPad and the book.
Integración de datos

Integra datos de diversas fuentes para obtener una visión completa y precisa de tu negocio.

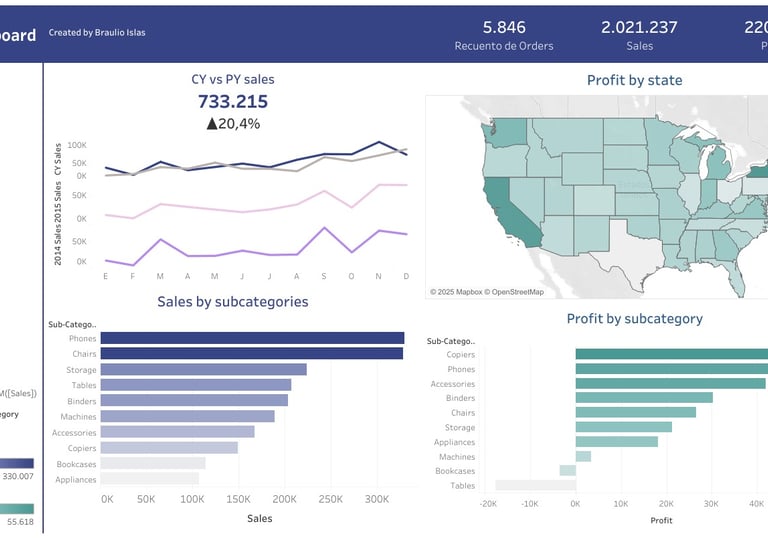
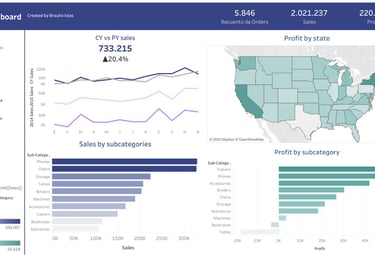
Diseño de dashboards

Dashboards dinámicos
A promotional banner with a bold red background features the text 'Data has a better idea' in large white letters. Above the text, the word 'HIVERY' is printed along with a stylized logo resembling a beehive. The background also includes a pattern of blue circles and dots, giving a digital or technological feel. In the surrounding area, there's a partial view of a desk and some office supplies.

Proyectos Innovadores

Soluciones avanzadas en business intelligence para decisiones informadas.

A digital screen displaying analytical data with line graphs, histograms, and numerical values. The data is presented in a user-friendly interface with different shades of blue used to distinguish various elements.
Transformación de Datos

Implementamos dashboards dinámicos y automatizamos tareas para optimizar procesos. Nuestra experiencia en Power BI y Tableau permite a las organizaciones maximizar el valor de su información.

A conference room setting with several laptops on a large table, each being used by a person. A large screen displays a blue interface with the text 'Generate ad creatives from any website with AI'. A stainless steel water bottle and a conference phone are also visible on the table.
Colaboración Estratégica

Trabajamos con negocios de todos los tamaños, impulsando su crecimiento y competitividad en un mercado cambiante mediante análisis estratégico e innovación en la gestión de datos.

Opiniones Clientes

Descubre lo que dicen nuestros clientes sobre nuestros servicios de BI.

Luum transformó nuestros datos en decisiones estratégicas, mejorando nuestra competitividad en el mercado actual. ¡Altamente recomendados!

Carlos Pérez
A computer screen displaying a data analytics dashboard with graphs and charts. A blue line graph shows fluctuations in data over time, and a section highlights the number of page views. A pie chart is partially visible, indicating a breakdown of different data elements.

Madrid, España.

La automatización de tareas y la integración de datos han sido clave para nuestro crecimiento. Luum nos ayudó a visualizar la información de manera efectiva y rápida.

A laptop with an open screen displaying dashboard analytics featuring charts, graphs, and numerical data related to sales and subscriptions. The interface is predominantly dark-themed with sections highlighting key performance metrics. The device shown is a MacBook Pro, indicated by the keyboard layout and branding.
Ana Gómez

Monterrey N.L.

★★★★★
★★★★★